Reverse Engineer Anything (REA): Setup, Electron Tutorial and Video Guide
Learn what REA does, install rea-agents, connect Codex or Claude Code, inspect an Electron app, choose a native provider and follow an evidence-first workflow.
REA, short for Reverse Engineer Anything, connects an AI coding agent to tools that inspect software without its original source repository. The official project is morluto/rea on GitHub, its website is rea.tools, and its npm package is rea-agents. It can help an agent investigate native binaries, JavaScript and Electron applications, .NET assemblies and websites, then explain the findings using evidence.
That does not mean one command recovers a complete original codebase. Depending on the target, the evidence may be pseudocode, assembly, recovered JavaScript modules, imports, IPC relationships or browser observations. Your agent still has to interpret the result and test any implementation it writes.
Sources checked October 13, 2026. The npm latest metadata returned rea-agents 6.4.0. This guide reviews official documentation and public examples; Uudir has not benchmarked REA or reproduced the showcased reverse-engineering results. Main-branch documentation may describe features not yet included in the npm release.
REA in one minute
| Question | Practical answer |
|---|---|
| Is it an AI model? | No. It exposes analysis workflows to your agent through MCP and to you through a CLI. |
| Where does analysis run? | Locally; tool results are then visible to your agent, whose model provider has its own data policy. |
| Do I need source code? | Not the original repository, but you need the relevant local artifact or accessible website. |
| Does Electron analysis require Ghidra? | Static JavaScript/Electron inspection does not need a native analysis engine. |
| What about native binaries? | Deep analysis uses a configured Hopper, Ghidra or IDA installation. |
| Can I use Codex or Claude Code? | Both are listed setup targets; other local-MCP clients also have documented paths. |
| Is this an online reverse-engineering service? | No. This page explains installation and workflows; it does not accept software uploads. |
How REA works with an agent
The agent starts with a question, asks REA to inspect a target, and receives findings together with evidence and limitations. It can then follow references, narrow the investigation and produce an explanation or a new implementation. CLI commands use the same workflows, so you can save evidence before asking an agent to reason about it.
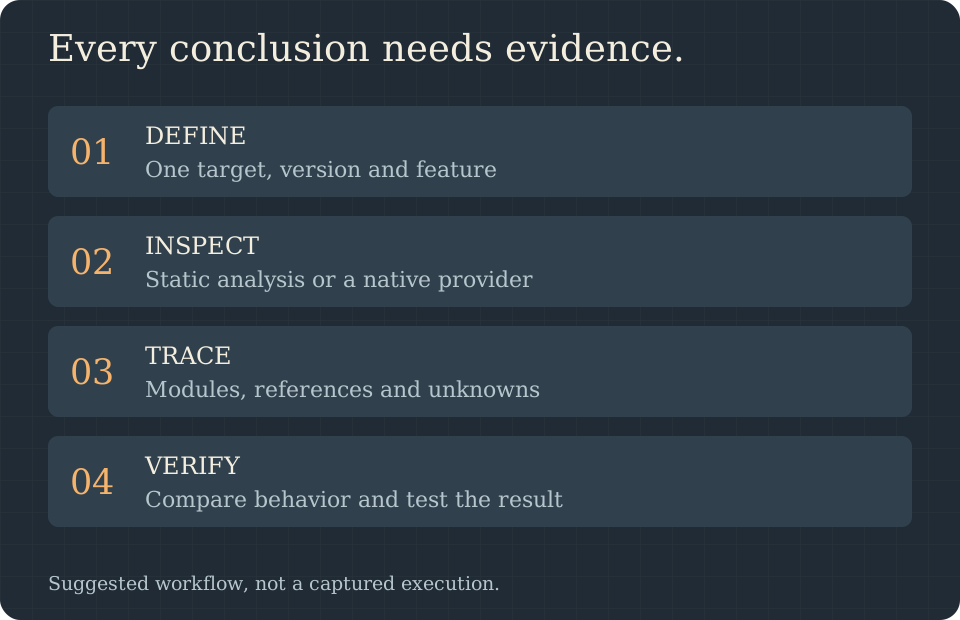
Three responsibilities remain separate. REA gathers and structures evidence. The analysis provider handles target-specific inspection. The agent reasons about the findings. A fluent explanation should still identify the module, symbol, reference or observation that supports it. If that connection is missing, ask for evidence before asking for more code.
Watch a REA demonstration
I Tested The Viral Github Repo To Reverse Engineer Anything, by Nick Saraev, is a third-party video introduction. The title and creator were verified against YouTube's metadata. Use it to see the investigation concept, and use the official installation documentation for current commands. This is not an official REA training course or independent proof that arbitrary software can be reconstructed.
While watching, keep four questions in view: What artifact did the presenter supply? Which provider was used? What evidence supports the claimed behavior? What test checks the reconstructed result? Those questions make the demonstration useful even if its version or interface differs from yours.
For written demonstrations, the official Notion clipboard case study follows an Electron renderer through preload and IPC into the main process. The DX-Ball case study follows a native sound-pan calculation into instructions and a reconstruction. These illustrate different workflows, not interchangeable installation requirements.
Before installing: check Node and choose a target
The current README and npm metadata require Node.js 22.x at 22.19 or later, 24.x at 24.11 or later, or 26+, plus npm. “Node 22” alone is not precise enough: 22.15, for example, does not meet the declared range.
Check your terminal:
node --version
npm --version
Choose one small target you own or are authorized to inspect. A copied Electron application directory or an ASAR is a useful first exercise because its static analysis does not require setting up a native engine. Keep the original artifact untouched and record its version. Avoid starting with “rebuild this entire application”; start with “find the renderer-to-main clipboard path.”
| Target | What you can inspect | Additional requirement |
|---|---|---|
| JavaScript / Electron | Modules, imports, source maps, routes, IPC and native add-on relationships | Node.js and npm; no native analysis engine for the static workflow. |
| Native executable | Pseudocode, assembly, strings, symbols, calls and references | Compatible Hopper, Ghidra or IDA setup. |
| Website | Page structure, scripts, network observations and requested screenshots | A Chrome-family browser and the documented browser workflow. |
| .NET assembly | Metadata, CIL and declared native dependencies | Static inspection; no native analysis engine required. |
| Go binary metadata | Embedded compiler version, modules and build settings | Built-in inspection of supported containers; no Go installation required. |
The README lists further Android, firmware, WASM and recorded-capture workflows. Each has its own host and tool prerequisites. Do not install every optional provider just to inspect one JavaScript app.
Install REA and connect your coding agent
Step 1: run the official setup command
npx rea-agents setup
Choose the agent clients you want to configure. The official setup adds the MCP registration and matching workflow instructions, presents proposed changes for review and backs up existing configuration. Restart the selected agent afterward so it loads the new server registration.
Supported setup targets include Claude Code, Codex, Cursor and Gemini CLI. The complete list lives in installation and setup; an unlisted MCP client may need manual registration. Do not assume an integration mentioned on main is already in the npm package.
Step 2: optionally install the terminal command
If you want a persistent rea command:
npm install --global rea-agents
rea --help
The global CLI is optional. A one-off invocation through npx can use the same workflow. Record your installed package version when sharing results so later readers can distinguish a command change from a target-specific problem.
Step 3: check only the integration you need
For a globally installed CLI, the official scoped checks include:
rea doctor --client codex --json
rea doctor --skill --json
Use the documented client identifier for your own agent. The doctor command checks configuration and prerequisites; it does not prove that the running agent has connected. After restarting, ask your agent whether it can see REA's tools and perform a small inspection.
Installing only the skill from skills.sh supplies investigation instructions. It does not replace registering the MCP server. Running setup is the documented route that connects both pieces.
First Electron tutorial: inspect, trace, verify
For a direct static inspection, use the official command with an absolute path:
npx -y rea-agents@latest analyze-javascript-application /absolute/path/to/app --json
On Windows, quote the path, especially if it contains spaces:
npx -y rea-agents@latest analyze-javascript-application "D:/apps/example" --json
The target can be an extracted JavaScript/Electron directory or an ASAR. The documented static workflow reads supplied files without executing the application. It returns an application graph and evidence, including module/import relationships and Electron boundaries. If the app includes a native add-on, identifying its relationship does not mean its internals were decompiled by the JavaScript pass.
Step 1: ask one bounded question
Use a prompt such as:
Inspect my authorized local Electron app at D:/apps/example. Start with static analysis. Trace how the renderer requests a clipboard write, through preload and IPC to the main-process handler. Cite module paths and relevant code or references. Separate observed facts, inferences and unknowns. Explain the flow before proposing implementation changes.
This specifies the artifact, the feature and the evidence required. The prompt is a suggested investigation brief, not a claim that every app uses the same clipboard architecture.
Step 2: follow process boundaries
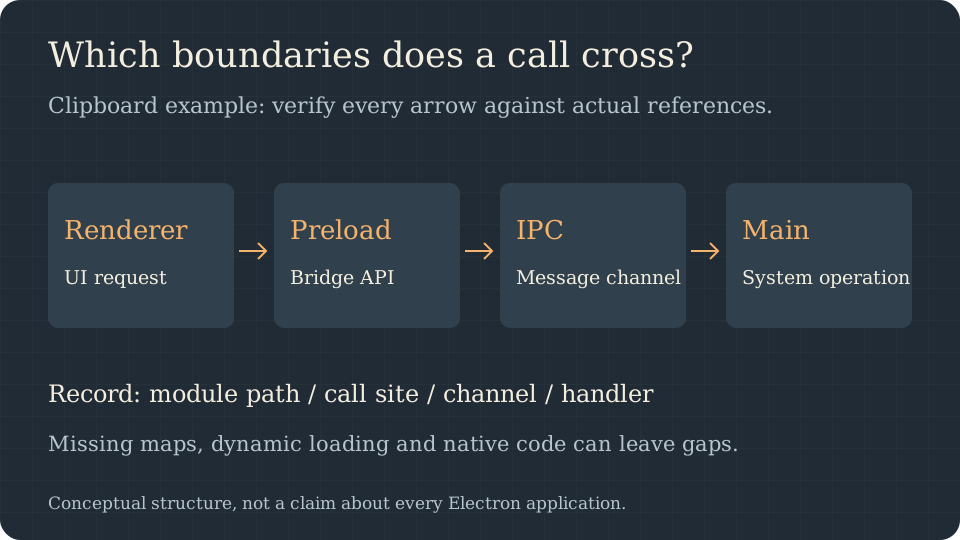
Look for the renderer call site, the exposed preload API, the IPC channel and the main-process handler. Record which links are directly visible and which remain unresolved. Minification, absent source maps, dynamic loading and native code can all limit what a static graph establishes.
The official Notion showcase is useful here because it examines a specific rich-clipboard bridge. It does not establish that all Notion versions, all clipboard formats or all Electron apps behave identically.
Step 3: save evidence instead of flooding the agent
The CLI and Evidence guide warns that a complete application evidence file can be hundreds of megabytes. With the global CLI, save the output:
rea analyze-javascript-application /absolute/path/to/app --json > app-evidence.json
Use the documented inspect-analysis-view workflow for a summary or a bounded module page. Keep the original evidence file and ask the agent for a focused view. Feeding a huge JSON file into one model message is neither necessary nor a substitute for tracing the relevant path.
Step 4: test the explanation or new implementation
If your goal is documentation, the deliverable may be a dependency map and unresolved questions. If your goal is a new feature, write it against your own project requirements and test it. For a clipboard feature, suggested cases include plain text, supported rich content, an empty selection, unsupported content and an unavailable clipboard path. Do not invent observations: mark cases you have not run as pending.
Native binaries: configure an engine first
Hopper, Ghidra and IDA are analysis providers, not alternative AI models. Their supported hosts and target formats differ. The installation guide describes optional Hopper installation with approval; Ghidra and IDA use your existing installations. Check provider-specific requirements before treating an executable extension as sufficient evidence of support.
For an existing Ghidra setup and global REA CLI:
rea doctor --provider ghidra --json
rea providers --json
rea analyze /absolute/path/to/program --provider ghidra --json
Begin with strings, symbols and an overview, then follow references into a small function relevant to your question. Pseudocode is a reconstruction of behavior, not the original variable names, comments, build scripts or repository. If multiple providers are available, explicit selection avoids ambiguity.
The official DX-Ball example reports 3,205 original-x86 cases and reproduction of 63 compiled function bytes for one sound-pan reconstruction. Those are the project's case-study results, not a Uudir benchmark or a success rate for arbitrary binaries. The useful lesson is the narrow target plus a concrete comparison test.
Websites: inspect what the browser can observe
REA's browser workflow uses a Chrome-family browser to examine page structure, scripts, network observations and requested screenshots. A good starting task is a single search or filtering interaction on a site you control: identify the trigger, visible state change, request shape and response handling.
Browser evidence does not expose a server's private source code. A request/response pair can support a statement about the observed contract, but it does not reveal the backend database schema or internal ranking algorithm. Separate visible behavior from speculation about server implementation.
Static file analysis and runtime interaction also have different effects. Reading an ASAR does not run the app; clicking or typing in a live browser may submit a request. Define the allowed interaction before capturing it, and use test data for forms. See the official browser guide for the current connection workflow.
Troubleshooting without installing everything
| Symptom | First check | Next step |
|---|---|---|
| Unsupported Node engine | Exact Node version, not just major version | Use one of the declared version ranges. |
| Agent cannot see REA | Registration and agent restart | Run a scoped client check; skill-only installation is insufficient. |
| doctor says unhealthy | Which checks are actually failing | Scope to your client/provider; unused optional engines may fail an audit-wide check. |
| JavaScript evidence is too large | Whether you requested the complete graph | Save it and request a summary/module page. |
| Native provider unavailable | Provider installation, host and selected engine | Follow the provider guide; do not assume installing REA installs all engines. |
| Command in docs is absent | Installed version versus main branch | Check release availability and the local help output. |
| A feature trace is incomplete | Missing source maps, dynamic loading or native boundaries | Report the limit and gather only the additional evidence required. |
For a global installation, the documented update path is rea update. For package-runner setup, use npx rea-agents@latest setup, review the changes and restart the agent. A global update and refreshing an agent registration are related but distinct steps.
What a useful REA report should contain
| Field | Example of useful detail |
|---|---|
| Target | App version, copied artifact path and digest if available. |
| Question | One observable feature or function, not “understand everything.” |
| Method | Static JavaScript, native provider or browser observation. |
| Evidence | Module paths, references, instructions or captured observations. |
| Conclusion | What is directly supported; what is inferred. |
| Limits | Unresolved dynamic calls, absent maps or untested runtime behavior. |
| Verification | Reproduction steps and expected versus observed behavior. |
REA is most useful when it shortens the distance from a question to evidence. It is less useful when a broad prompt produces a confident story with no references. For a different developer workflow centered on vulnerability triage, see our Anthropic OSS Scanner guide.
Frequently asked questions
Can REA recover the original source code?
It can expose different forms of evidence, including pseudocode/assembly for native code and module relationships for JavaScript. That is not a guarantee of recovering the complete original source repository or a buildable clone.
Do I need to buy Hopper or IDA?
Not for static JavaScript/Electron or .NET inspection. Deep native analysis needs a compatible provider; each tool has its own license and requirements. REA's MIT license does not grant a commercial provider license.
Does it work with Codex, Claude Code and Cursor?
The official setup supports them. Restart the selected client after registration, then verify a small tool call. Other clients can follow manual MCP instructions where applicable.
Does local analysis mean all data stays on my computer?
No. REA analyzes locally, but its tool results are passed to your agent. A remotely hosted model may receive those results under its provider's data policy. Local analysis and local model inference are separate choices.
Can REA reveal a website's backend source?
Browser inspection reveals observable page behavior, delivered scripts and network exchanges. It does not grant access to private backend code. Do not turn a frontend observation into an unsupported backend claim.
What should a beginner try first?
A small authorized Electron or JavaScript artifact and one feature trace are a manageable start. Save evidence, ask for module-level references, and write down unknowns before adding runtime capture or native providers.
Is REA itself free and open source?
REA-authored code is MIT-licensed. Third-party dependencies and analysis tools retain their own terms. Model usage and commercial tooling can still cost money.
Sources and next steps
- Official repository and README: project identity, target matrix and workflow.
- Installation guide: setup, client registration, scoped diagnostics and release availability.
- CLI and Evidence: commands, provider selection and saved evidence views.
- npm package: published package metadata and version.
- Official guides and showcases: worked examples.
- Nick Saraev video: third-party introduction, not the installation source of truth.
Uudir Editorial Team · October 13, 2026. Original diagrams explain suggested workflows; they are not software screenshots or reproduced test results.